

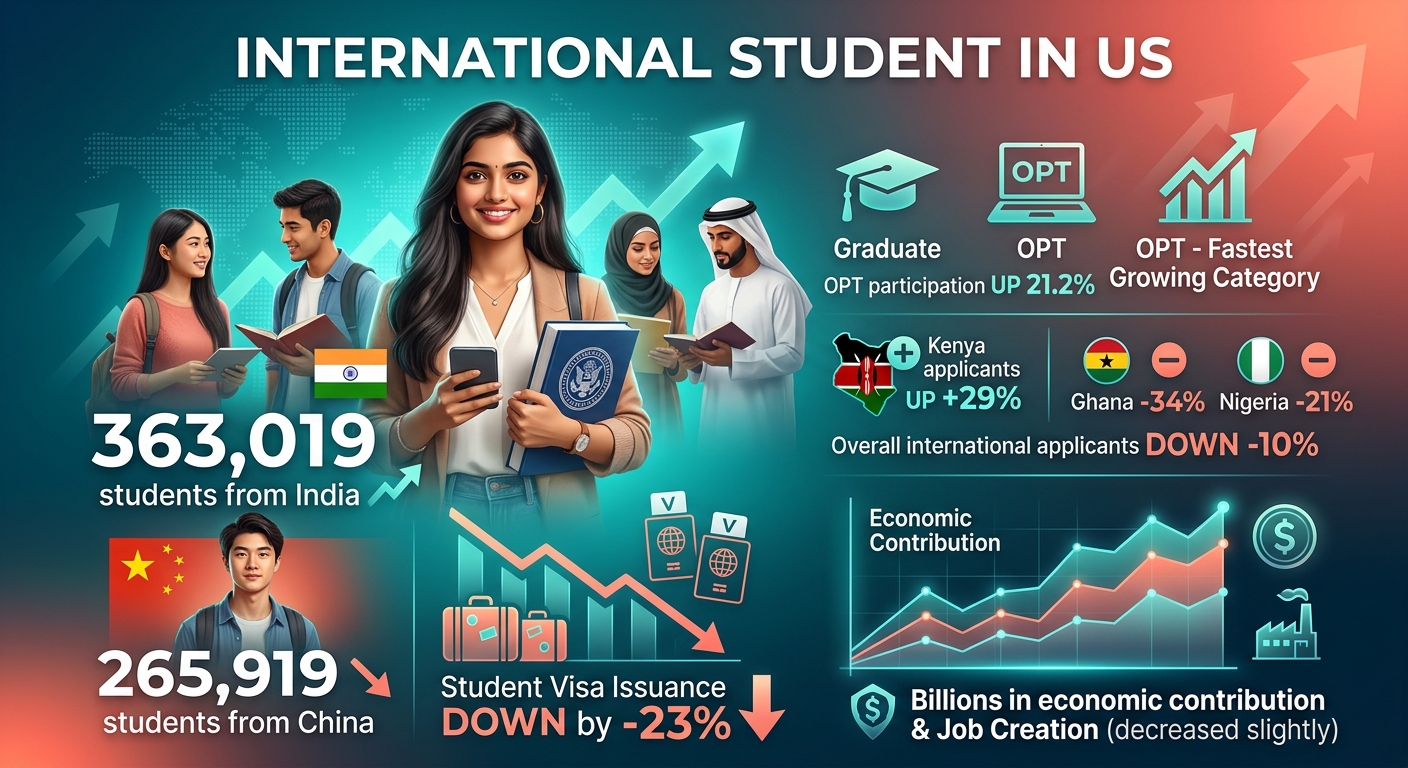
US colleges and universities hosted 1,177,766 international students in 2024/25, up 4.5% from 1,126,690 a year earlier. Student visa issuance then fell sharply in calendar 2025, and applications fell again in the 2025–26 cycle. This page tracks international students in the US by country of origin using Open Doors enrollment counts, State Department visa issuance data, Common App applicant volumes and NAFSA’s fall 2026 projections.
International Students in the US by Country of Origin
- 1,177,766 international students studied at US institutions in 2024/25, up 4.5% from 1,126,690 in 2023/24, per the Open Doors census.
- India accounted for 363,019 students, or 30.8% of the world total, a 9.5% rise.
- China accounted for 265,919 students, or 22.6% of the total, a 4.1% decline.
- F-1 visa issuance fell 33.4% in calendar 2025 against 2024, State Department figures show.
- NAFSA and JB International project up to 111,000 fewer international students in fall 2026, a 9.5% drop.
How Many International Students Are in the US by Country of Origin?
The Open Doors census counts enrolled students plus those on Optional Practical Training for a full academic year. India and China supplied 30.8% and 22.6% of the 2024/25 total, a combined 53.4%.
Nepal posted the steepest rise among the top 15 at 48.7%, moving from tenth place to sixth. Saudi Arabia fell 14.3%, the largest decline in the group.
Top 15 Places of Origin, 2023/24 and 2024/25
| Place of origin | 2023/24 | 2024/25 | % of total | % change |
|---|---|---|---|---|
| India | 331,602 | 363,019 | 30.8 | 9.5 |
| China | 277,398 | 265,919 | 22.6 | -4.1 |
| South Korea | 43,149 | 42,293 | 3.6 | -2.0 |
| Canada | 28,998 | 29,903 | 2.5 | 3.1 |
| Vietnam | 22,066 | 25,584 | 2.2 | 15.9 |
| Nepal | 16,742 | 24,890 | 2.1 | 48.7 |
| Taiwan | 23,157 | 23,263 | 2.0 | 0.5 |
| Nigeria | 20,029 | 21,847 | 1.9 | 9.1 |
| Bangladesh | 17,099 | 20,156 | 1.7 | 17.9 |
| Brazil | 16,877 | 17,277 | 1.5 | 2.4 |
| Mexico | 15,474 | 15,652 | 1.3 | 1.2 |
| Japan | 13,959 | 13,814 | 1.2 | -1.0 |
| Pakistan | 10,988 | 13,165 | 1.1 | 19.8 |
| Ghana | 9,394 | 12,825 | 1.1 | 36.5 |
| Saudi Arabia | 14,828 | 12,702 | 1.1 | -14.3 |
| World total | 1,126,690 | 1,177,766 | 100.0 | 4.5 |
Source: Institute of International Education, Open Doors 2025 Fast Facts, international student census, 2023/24 and 2024/25.
Twelve of the top 25 places of origin reached their largest counts to date, IIE reports: Bangladesh, Canada, Colombia, Ghana, India, Italy, Nepal, Nigeria, Pakistan, Peru, Spain and Vietnam.
International Students in the US by Country of Origin and Academic Level
Graduate enrollment fell 2.7% to 488,481 in 2024/25 after three years of growth. OPT participation rose 21.2% to 294,253, the fastest-growing category in the census.
New enrollments, counted separately from the totals above, dropped 7.2% to 277,118. A further 16,913 international students enrolled online from abroad, a channel that sits alongside broader online education market figures.
Source: Institute of International Education, Open Doors 2025 Fast Facts, academic level, 2024/25.
Why Did US Student Visa Issuance Fall in 2025?
Student visa issuance is a leading indicator and it turned before enrollment did. Inside Higher Ed’s analysis of State Department issuance data found totals tracking 2024 levels through early 2025, then dropping in May, the month student visa interviews were paused for expanded social media screening.
The department did not publish monthly issuance data between September 2025 and August 2026, a gap NAFSA cited as a missing forecasting input.
Student Visa Issuance Change by Class, Calendar 2025 vs 2024
| Visa class | Change in visas issued |
|---|---|
| F-1 (degree study) | -33.4% |
| J-1 (exchange programs) | -9.9% |
| M-1 (vocational, non-degree) | -6.7% |
| All student visa classes combined | -23% |
Source: US Department of State visa issuance data, calendar years 2024 and 2025, analyzed by Inside Higher Ed, August 2026.
Student Visa Issuance Change by Country of Origin, 2025 vs 2024
| Country of origin | Change in student visas issued |
|---|---|
| Iran | More than -90% |
| India | -56.6% |
| China | -28% |
| Serbia | +21.6% |
| Moldova | +17.2% |
Source: US Department of State visa issuance data, calendar years 2024 and 2025, analyzed by Inside Higher Ed, August 2026. Covers F, M and J classes combined.
Of more than 200 countries listed in the data, 32 recorded year-over-year increases, and several of those involved very small numbers. Iran and Nigeria are covered by the December 16, 2025 executive order restricting entry from 39 countries, which carries no carve-out for F or J applicants.
Canada is the third-largest place of origin in the enrollment census but does not appear in visa issuance data, since Canadian citizens do not need a student visa to study in the US.
F-1 Visas Issued to India and China, May to August
The Center for Immigration Studies compared the May–August window, which carried 77% of India’s annual F-1 issuance in 2024 and 76% of China’s.
| Country of origin | May–Aug 2024 | May–Aug 2025 | % change |
|---|---|---|---|
| India | 58,694 | 22,149 | -62 |
| China | 61,075 | 40,034 | -34 |
Source: Center for Immigration Studies analysis of State Department Visa Office monthly issuance reports, May–August 2024 and May–August 2025.
What Do 2026 Applications Show About International Students in the US by Country of Origin?
Common App’s end-of-season report covers applications submitted between August 1, 2025 and July 28, 2026 to 1,146 member institutions. International first-year applicants fell 10% while domestic applicants rose, lifting the platform total 2% to 1,527,328.
Kenya was the only one of the ten highest-volume countries of citizenship to grow. Applicants from the Americas rose 5%.
Most applicants from these corridors sit a standardised English test before applying, and IELTS candidate volumes by country cover the same markets.
| Group | Type | Change in first-year applicants |
|---|---|---|
| All international | Total | -10% |
| Asia | Region | -11% |
| Africa | Region | -17% |
| Americas | Region | +5% |
| India | Country | -15% |
| Ghana | Country | -34% |
| Ethiopia | Country | -29% |
| Nigeria | Country | -21% |
| Kenya | Country | +29% |
Source: Common App, End-of-Season Report 2025–2026, published August 20, 2026. Figures are changes in first-year applicant counts against the 2024–25 season.
Ghana and Nigeria grew 36.5% and 9.1% in the 2024/25 enrollment census and now post two of the steepest application declines. Rajika Bhandari of Rajika Bhandari Advisors told Inside Higher Ed that prospective students are pivoting to nontraditional European destinations and to countries closer to home, a shift that raises the profile of entry requirements such as TestDaF scoring for German universities.
Doctoral programs show the sharpest pullback. The Association of American Universities Data Exchange recorded international applications to US doctoral programs down 21% for fall 2026, international admissions down 17% and total doctoral admissions down 15%.
Projected International Students in the US by Country of Origin, Fall 2026
NAFSA and JB International published preliminary projections on August 11, 2026, built from institutional responses to IIE’s Spring 2026 Snapshot. The analysis groups institutions into four quartiles and models undergraduate, graduate and non-degree levels separately.
NAFSA states that actual fall 2026 results could fall outside the projected range, and that between 22% and 36% of institutions responded across quartiles.
| Scenario | International students | Dollars contributed | Jobs supported |
|---|---|---|---|
| 2024–25 actuals | 1,177,766 | $42.90 billion | 355,736 |
| Fall 2025–26 projection | 1,168,602 | $41.77 billion | 332,939 |
| Fall 2026–27 mid-projection | 1,104,912 | $39.62 billion | 303,514 |
| Fall 2026–27 upper-projection | 1,056,884 | $38.37 billion | 293,743 |
Source: NAFSA and JB International, Fall 2026 International Student Enrollment Outlook & Economic Impact, August 11, 2026.
Graduate-level declines are the primary driver of the projected economic losses, NAFSA reports, concentrated at institutions with the largest international cohorts. Nearly two-thirds of institutions responding to the Spring 2026 Snapshot expect further declines in 2026–27.
Economic Value by Country of Origin
International students contributed $42.9 billion and supported 355,736 jobs in 2024–25, against $43.8 billion and 378,175 jobs in 2023–24. NAFSA describes the 2.1% dollar decline as the first recorded since the pandemic period.
Community college contributions rose 10.5% to $2.2 billion, supporting 9,099 jobs. English language program contributions rose 5.7% to $393.3 million and remain 44% below pre-pandemic levels, a demand signal that tracks wider global English speaker data.
NAFSA states one US job is created or supported for every three international students. Its fall 2026 projection puts up to 40,000 jobs at risk, roughly a 9% reduction from the fall 2025 baseline, in sectors including housing, dining, retail and transportation. Post-study work through OPT sits against a tight entry-level market documented in Gen Z hiring data.
Why SEVIS and Open Doors Counts Differ by Country of Origin
The two headline sources measure different things. Open Doors surveys institutions across a full academic year and counts enrolled students plus those on OPT, returning 363,019 Indian students for 2024/25.
SEVIS is a point-in-time Department of Homeland Security record count. India’s Ministry of External Affairs cited SEVIS Mapping Tool figures in the Rajya Sabha on April 2, 2026 showing 352,644 Indian students in February 2026 against 378,787 in February 2025, a 6.9% decline.
Different reference dates and different inclusion rules explain the gap. The 6.9% SEVIS decline and the 9.5% Open Doors increase describe different periods and different populations, not contradictory findings.
Reference boundaries vary across education datasets generally, a point the regional HSK candidate breakdown illustrates for Chinese-language testing.
FAQs
Which country sends the most international students to the US?
India. Open Doors recorded 363,019 Indian students in 2024/25, or 30.8% of all international students, ahead of China at 265,919, or 22.6%. India held the top spot for a second consecutive year.
How many international students are in the US?
1,177,766 studied at US institutions in 2024/25, per Open Doors, up 4.5% from 1,126,690. NAFSA projects between 1,056,884 and 1,104,912 for 2026–27, depending on scenario.
Why are Indian student numbers in the US falling?
Student visa issuance to Indian nationals fell 56.6% in calendar 2025, State Department data shows. NAFSA cites visa appointment bottlenecks, expanded screening from June 2025 and the new duration-of-status rule as contributing factors.
Is Reddit a reliable source for US student visa approval rates?
No. Reddit threads report individual outcomes, not measured rates. Published issuance counts come from the State Department’s monthly visa reports; enrollment counts come from Open Doors and the DHS SEVIS system.
How much do international students contribute to the US economy?
$42.9 billion in 2024–25, supporting 355,736 jobs, according to NAFSA. That is down 2.1% from $43.8 billion in 2023–24. NAFSA projects a further $3.4 billion loss in fall 2026.
Sources
https://opendoorsdata.org/wp-content/uploads/2025/11/OD25_Fast-Facts.pdf
https://www.nafsa.org/sites/default/files/media/document/Fall_2026_International_Student_Economic_Snapshot_NAFSA_JBI.pdf
https://www.commonapp.org/files/DAR/deadline-updates/2025-26/Common-App-End-of-Season-Report_25-26.pdf
https://travel.state.gov/content/travel/en/legal/visa-law0/visa-statistics/nonimmigrant-visa-statistics/monthly-nonimmigrant-visa-issuances.html
