

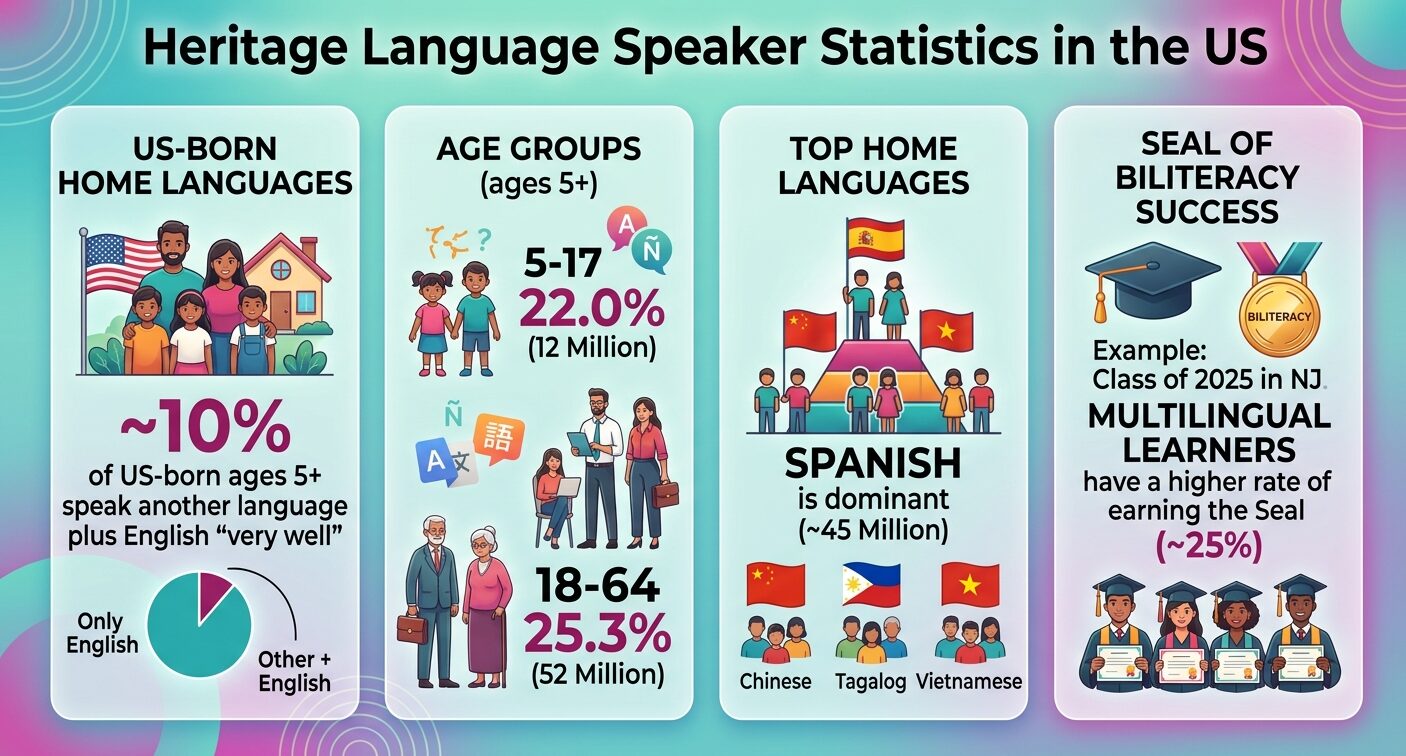
No federal survey counts heritage language speakers directly, so this guide relies on the closest published proxies. The Census Bureau’s 2024 American Community Survey (ACS) recorded 74,050,833 residents ages 5 and older who spoke a language other than English at home. The sections below split that figure by birthplace, age and language, then cover Latino Spanish use, Seal of Biliteracy results and a 2025 college survey of heritage speakers.
Heritage Language Speaker Statistics in the US
How Many Heritage Language Speakers Live in the US?
No exact count exists. The ACS asks about home language, English ability and birthplace, but not heritage status.
The nearest proxy is U.S.-born residents who use another language at home. Of 271,917,897 U.S.-born residents ages 5 and older, 88.1% spoke only English in 2024 and 9.9% spoke another language plus English “very well.”
| Group (ages 5+, 2024) | Population | Speak only English | Speak another language, English “very well” |
|---|---|---|---|
| U.S.-born | 271,917,897 | 88.1% | 9.9% |
| Foreign-born | 49,828,046 | 16.3% | 36.6% |
Source: Migration Policy Institute tabulation of ACS data, 2024
Immigrants show a different split. Among foreign-born residents, 47.1% spoke English less than “very well” in the same MPI data.
State-level shares for this ACS measure are compiled in LingoBright’s bilingualism rates by US state.
MPI’s U.S.-born group includes people born in Puerto Rico and other U.S. territories, plus people born abroad to a U.S.-citizen parent.
22% of US Children Ages 5 to 17 Speak Another Language at Home
Heritage languages are picked up in childhood. In 2024, 12,028,981 children ages 5 to 17, or 22.0%, spoke a language other than English at home.
Working-age adults ages 18 to 64 posted the highest rate at 25.3%, or 52,130,195 people. Residents 65 and older posted the lowest at 16.2%.
Pay offers tied to a second language are tracked in this salary premium data for bilingual employees.
| Age group (2024) | Speak only English | Speak another language at home |
|---|---|---|
| 5 to 17 | 42,535,284 (78.0%) | 12,028,981 (22.0%) |
| 18 to 64 | 153,806,200 (74.7%) | 52,130,195 (25.3%) |
| 65 and older | 51,353,626 (83.8%) | 9,891,657 (16.2%) |
Source: Migration Policy Institute tabulation of ACS data, 2024
Which Heritage Languages Are Most Common in the US?
Spanish led with 44,867,699 home speakers ages 5 and older in 2024. Chinese (incl. Mandarin, Cantonese) followed at 3,734,956, then Tagalog (incl. Filipino) at 1,921,526.
Eleven languages topped 1 million home speakers each. The counts include immigrants, so they show the pool heritage speakers come from, not heritage speakers alone.
| Language | Home speakers ages 5+ (2024) |
|---|---|
| Spanish | 44,867,699 |
| Chinese (incl. Mandarin, Cantonese) | 3,734,956 |
| Tagalog (incl. Filipino) | 1,921,526 |
| Vietnamese | 1,599,409 |
| Arabic | 1,484,439 |
| French (incl. Cajun) | 1,276,702 |
| Korean | 1,150,701 |
| Portuguese | 1,099,503 |
| Hindi | 1,059,933 |
| Haitian | 1,041,231 |
| Russian | 1,021,165 |
Source: U.S. Census Bureau, ACS 1-year estimates (table C16001), 2024
Spanish Heritage Speakers: Pew Data for 2000 and 2024
The US Latino population reached 68 million in 2024, or 20% of residents, per Pew Research Center.
Spanish use at home fell from 78% of Latinos ages 5 and older in 2000 to 68% in 2024. English proficiency rose from 59% to 71%, or 44.8 million people.
Pew attributes the proficiency gain to U.S.-born Latinos. Their English proficiency share rose 10 percentage points since 2000, against 4 points for Latino immigrants.
Formal certification is a separate measure from home use; DELE candidate statistics cover registrations and pass rates for that Spanish exam.
Two-thirds of Latinos (67%) were US citizens by birth in 2024. Pew defines English proficiency as speaking only English at home or speaking English “very well.”
Source: Pew Research Center, Key facts about U.S. Latinos (October 2025), 2000 and 2024 data
Do Heritage Speakers Earn the Seal of Biliteracy?
New Jersey and Arizona both report how many Seal recipients were current or former English learners.
New Jersey, Class of 2025
New Jersey awarded the Seal to 12,200 students in 2024-25, with 12,644 Seals across 61 languages. That covers 11.1% of the Class of 2025.
Multilingual learners graduated with the Seal at a 25.5% rate. Students who never received multilingual services did so at 8.9%.
| Student group (2024-25) | Students earning Seals | Share of 12th graders in group |
|---|---|---|
| All students | 12,200 | 11.1% |
| Hispanic | 7,160 | 19.9% |
| Asian | 1,673 | 14.7% |
| White | 2,872 | 6.6% |
| Black or African American | 325 | 2.0% |
Source: New Jersey Department of Education, State Seal of Biliteracy Annual Report, 2024-25
Seals for multilingual and former multilingual learners rose from 2,862 in 2023-24 to 3,630 in 2024-25. Since 2016, the state has awarded 62,324 Seals, and 14,610 multilingual learners have earned one.
| School year | Non-MLs awarded Seals | MLs and former MLs awarded Seals |
|---|---|---|
| 2016-17 | 1,724 | 283 |
| 2017-18 | 2,985 | 553 |
| 2018-19 | 4,292 | 1,052 |
| 2019-20 | 5,481 | 1,427 |
| 2020-21 | 3,914 | 864 |
| 2021-22 | 5,249 | 1,652 |
| 2022-23 | 6,255 | 2,228 |
| 2023-24 | 7,388 | 2,862 |
| 2024-25 | 8,559 | 3,630 |
Source: New Jersey Department of Education, Seals by learner group, 2016-17 to 2024-25
Spanish accounted for 9,474 Seals in 2024-25, followed by French (705) and Portuguese (422).
Approved Spanish evidence includes DELE and SIELE at B1, alongside AP, AAPPL and STAMP; this DELE vs SIELE comparison sets out fees and candidate volume.
Arizona, 2025-26
Arizona awarded 4,080 Seals to graduating seniors in 2025-26, compared with 3,281 for the Class of 2025. Of the 2025-26 recipients, 898 had been designated English Language Learners at some point in K-12, up from 708.
| Measure | 2024-25 | 2025-26 |
|---|---|---|
| Students awarded the Seal | 3,281 | 4,080 |
| Recipients designated English Language Learners in K-12 | 708 | 898 |
| Recipients who attended Title 1 schools | 1,696 | 1,881 |
Source: Arizona Department of Education, Seal of Biliteracy Annual Reports, 2024-25 and 2025-26
Arizona’s three ABOR universities accept the state Seal as meeting their two-year foreign language requirement. Workplace demand for certified language skills appears in this job market data for certified bilingual workers.
Spanish made up 3,452 of Arizona’s 2025-26 Seals, and students earned Seals in 33 languages.
Heritage Language Speaker Statistics in US Colleges
Northwestern University’s 2025 Student Language Survey drew 1,835 responses from 2,350 incoming first-year and transfer students, a 78% response rate.
The survey flagged 904 respondents, or 49.3%, as possible heritage language speakers. These students reported extensive exposure to another language but attended a high school where English was the main language of instruction.
| Measure (2025 survey) | Students | Share of 1,835 respondents |
|---|---|---|
| Extensive exposure to a language other than English | 1,001 | 54.6% |
| Possible heritage language speakers | 904 | 49.3% |
| Possible heritage speakers of a language Northwestern teaches | 733 | Not reported |
| Plan to study a language at Northwestern | 1,336 | 72.8% |
| Received non-English AP credit | 440 | 23.9% |
Source: Northwestern University Language Resource Center, 2025 Student Language Survey Impact Report
The report warns that open-ended answers and varied language names may affect counts. Results cover one university, not a national sample.
A national picture is still in progress. UCLA’s National Heritage Language Resource Center is surveying heritage speakers at two- and four-year colleges, including students outside language courses, and presented a preliminary analysis on May 13, 2025.
Source: UCLA National Heritage Language Resource Center, Heritage Language Survey, 2025
When Will 2025 Heritage Language Data Be Released?
The Census Bureau has scheduled the 2025 ACS 1-year estimates for release on October 29, 2026, per its data release page revised October 13, 2026.
An August 4, 2026 Bureau release said that date was still being set while the agency assessed a new Commerce Department order on disclosure avoidance for statistical products.
For comparison, the 2024 ACS 1-year estimates came out on September 11, 2025. Until the new release, 2024 stays the latest year for home-language counts by birthplace and age.
Source: U.S. Census Bureau, ACS data release schedules, 2024 and 2025 estimates
FAQs
What is a heritage language speaker?
A person who grew up with a minority language at home and later shifted toward English through school. Northwestern’s 2025 survey used a working proxy: extensive non-English exposure plus an English-medium high school.
How many heritage language speakers are in the US?
No official count exists. The nearest proxies: 74,050,833 residents ages 5+ spoke another language at home in 2024, and 9.9% of U.S.-born residents spoke another language plus English “very well,” per MPI’s ACS tabulation.
What is the most common heritage language in the US?
Spanish, by a wide margin. The 2024 ACS counted 44,867,699 Spanish home speakers ages 5 and older, ahead of Chinese (incl. Mandarin, Cantonese) at 3,734,956 and Tagalog (incl. Filipino) at 1,921,526.
What percentage of Latinos speak Spanish at home?
Sixty-eight percent of Latinos ages 5 and older spoke Spanish at home in 2024, down from 78% in 2000, per Pew Research Center. English proficiency rose from 59% to 71% over the same period.
Is there an official heritage speaker count to use instead of Reddit anecdotes?
Not a direct one. The Census Bureau’s ACS measures home language by birthplace and age. The latest year is 2024, and 2025 one-year estimates are scheduled for October 29, 2026.
